Scree, loadings and explained variance
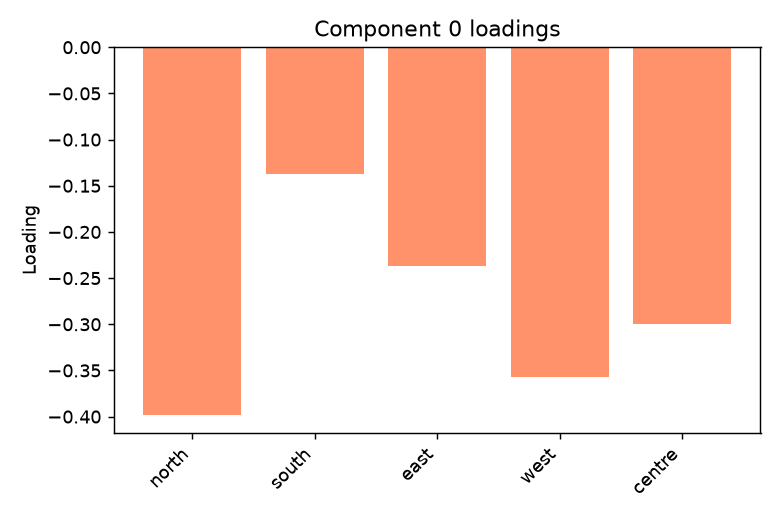
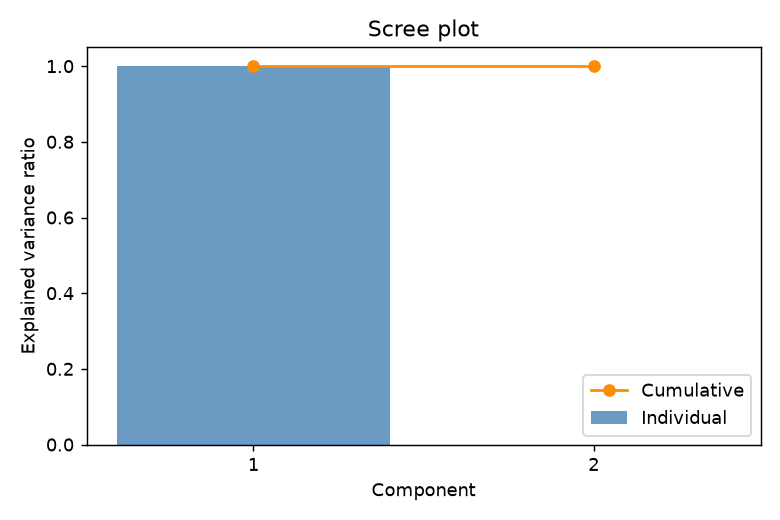
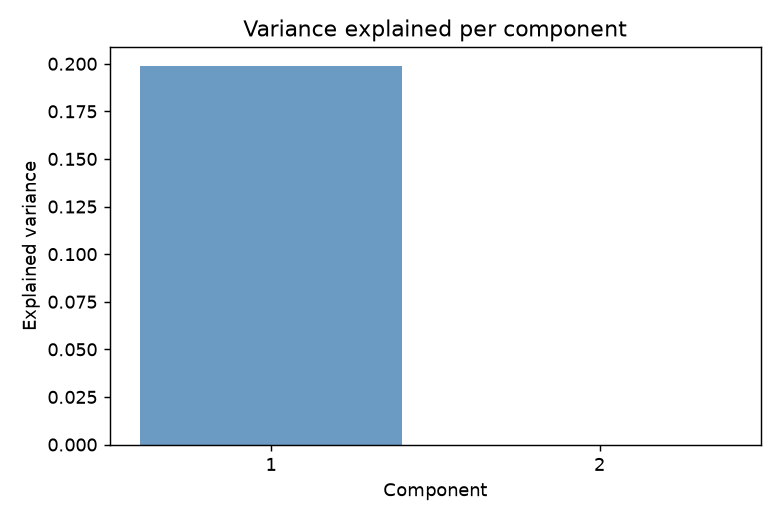
Each plot reads the returned fitted state through public plotting helpers. Explained variance is shown both as a ratio and in absolute units.
These synthetic examples run at most eight fit iterations. They demonstrate API behavior; they do not establish posterior convergence, calibration or a recommended capacity.
This example uses the 0.5 API with the plot extra. From a matching source checkout, install python -m pip install '.[plot]', then run python scripts/gallery_plots.py --output-dir outputs. The downloaded source can also run directly against that installed 0.5 build.
Download this standalone source.
Output
{
  "capacity": 2,
  "explained_variance": [
    0.1987384765083501,
    1.8750941514774964e-10
  ],
  "explained_variance_ratio": [
    0.9999999990565016,
    9.434983012107196e-10
  ],
  "component_zero_loadings": [
    -0.39796453214189553,
    -0.13705029753808098,
    -0.2366101842431367,
    -0.35733076841477307,
    -0.29950631696173063
  ]
}
Executed source
"""Plot explained variance and loadings from the returned fitted state."""

import argparse
import json
from pathlib import Path

import matplotlib.pyplot as plt
import numpy as np

from vbpca_py import VBPCA
from vbpca_py.plotting import loadings_barplot, scree_plot, variance_explained_plot


def run_example(output_dir):
    x = np.random.default_rng(25).normal(size=(24, 5))
    model = VBPCA(
        2,
        maxiters=8,
        niter_broadprior=0,
        random_state=25,
        runtime_tuning="off",
        num_cpu=1,
        verbose=0,
    ).fit(x)
    output_dir.mkdir(parents=True, exist_ok=True)
    for name, figure in [
        ("scree", scree_plot(model)),
        (
            "loadings",
            loadings_barplot(
                model, feature_names=["north", "south", "east", "west", "centre"]
            ),
        ),
        ("variance", variance_explained_plot(model)),
    ]:
        figure.savefig(output_dir / f"{name}.png", dpi=130)
        plt.close(figure)
    summary = {
        "capacity": model.components_.shape[0],
        "explained_variance": model.explained_variance_.tolist(),
        "explained_variance_ratio": model.explained_variance_ratio_.tolist(),
        "component_zero_loadings": model.components_[0].tolist(),
    }
    (output_dir / "summary.json").write_text(json.dumps(summary, indent=2) + "\n")
    print(json.dumps(summary, indent=2))


if __name__ == "__main__":
    parser = argparse.ArgumentParser(description=__doc__)
    parser.add_argument("--output-dir", type=Path, required=True)
    run_example(parser.parse_args().output_dir)